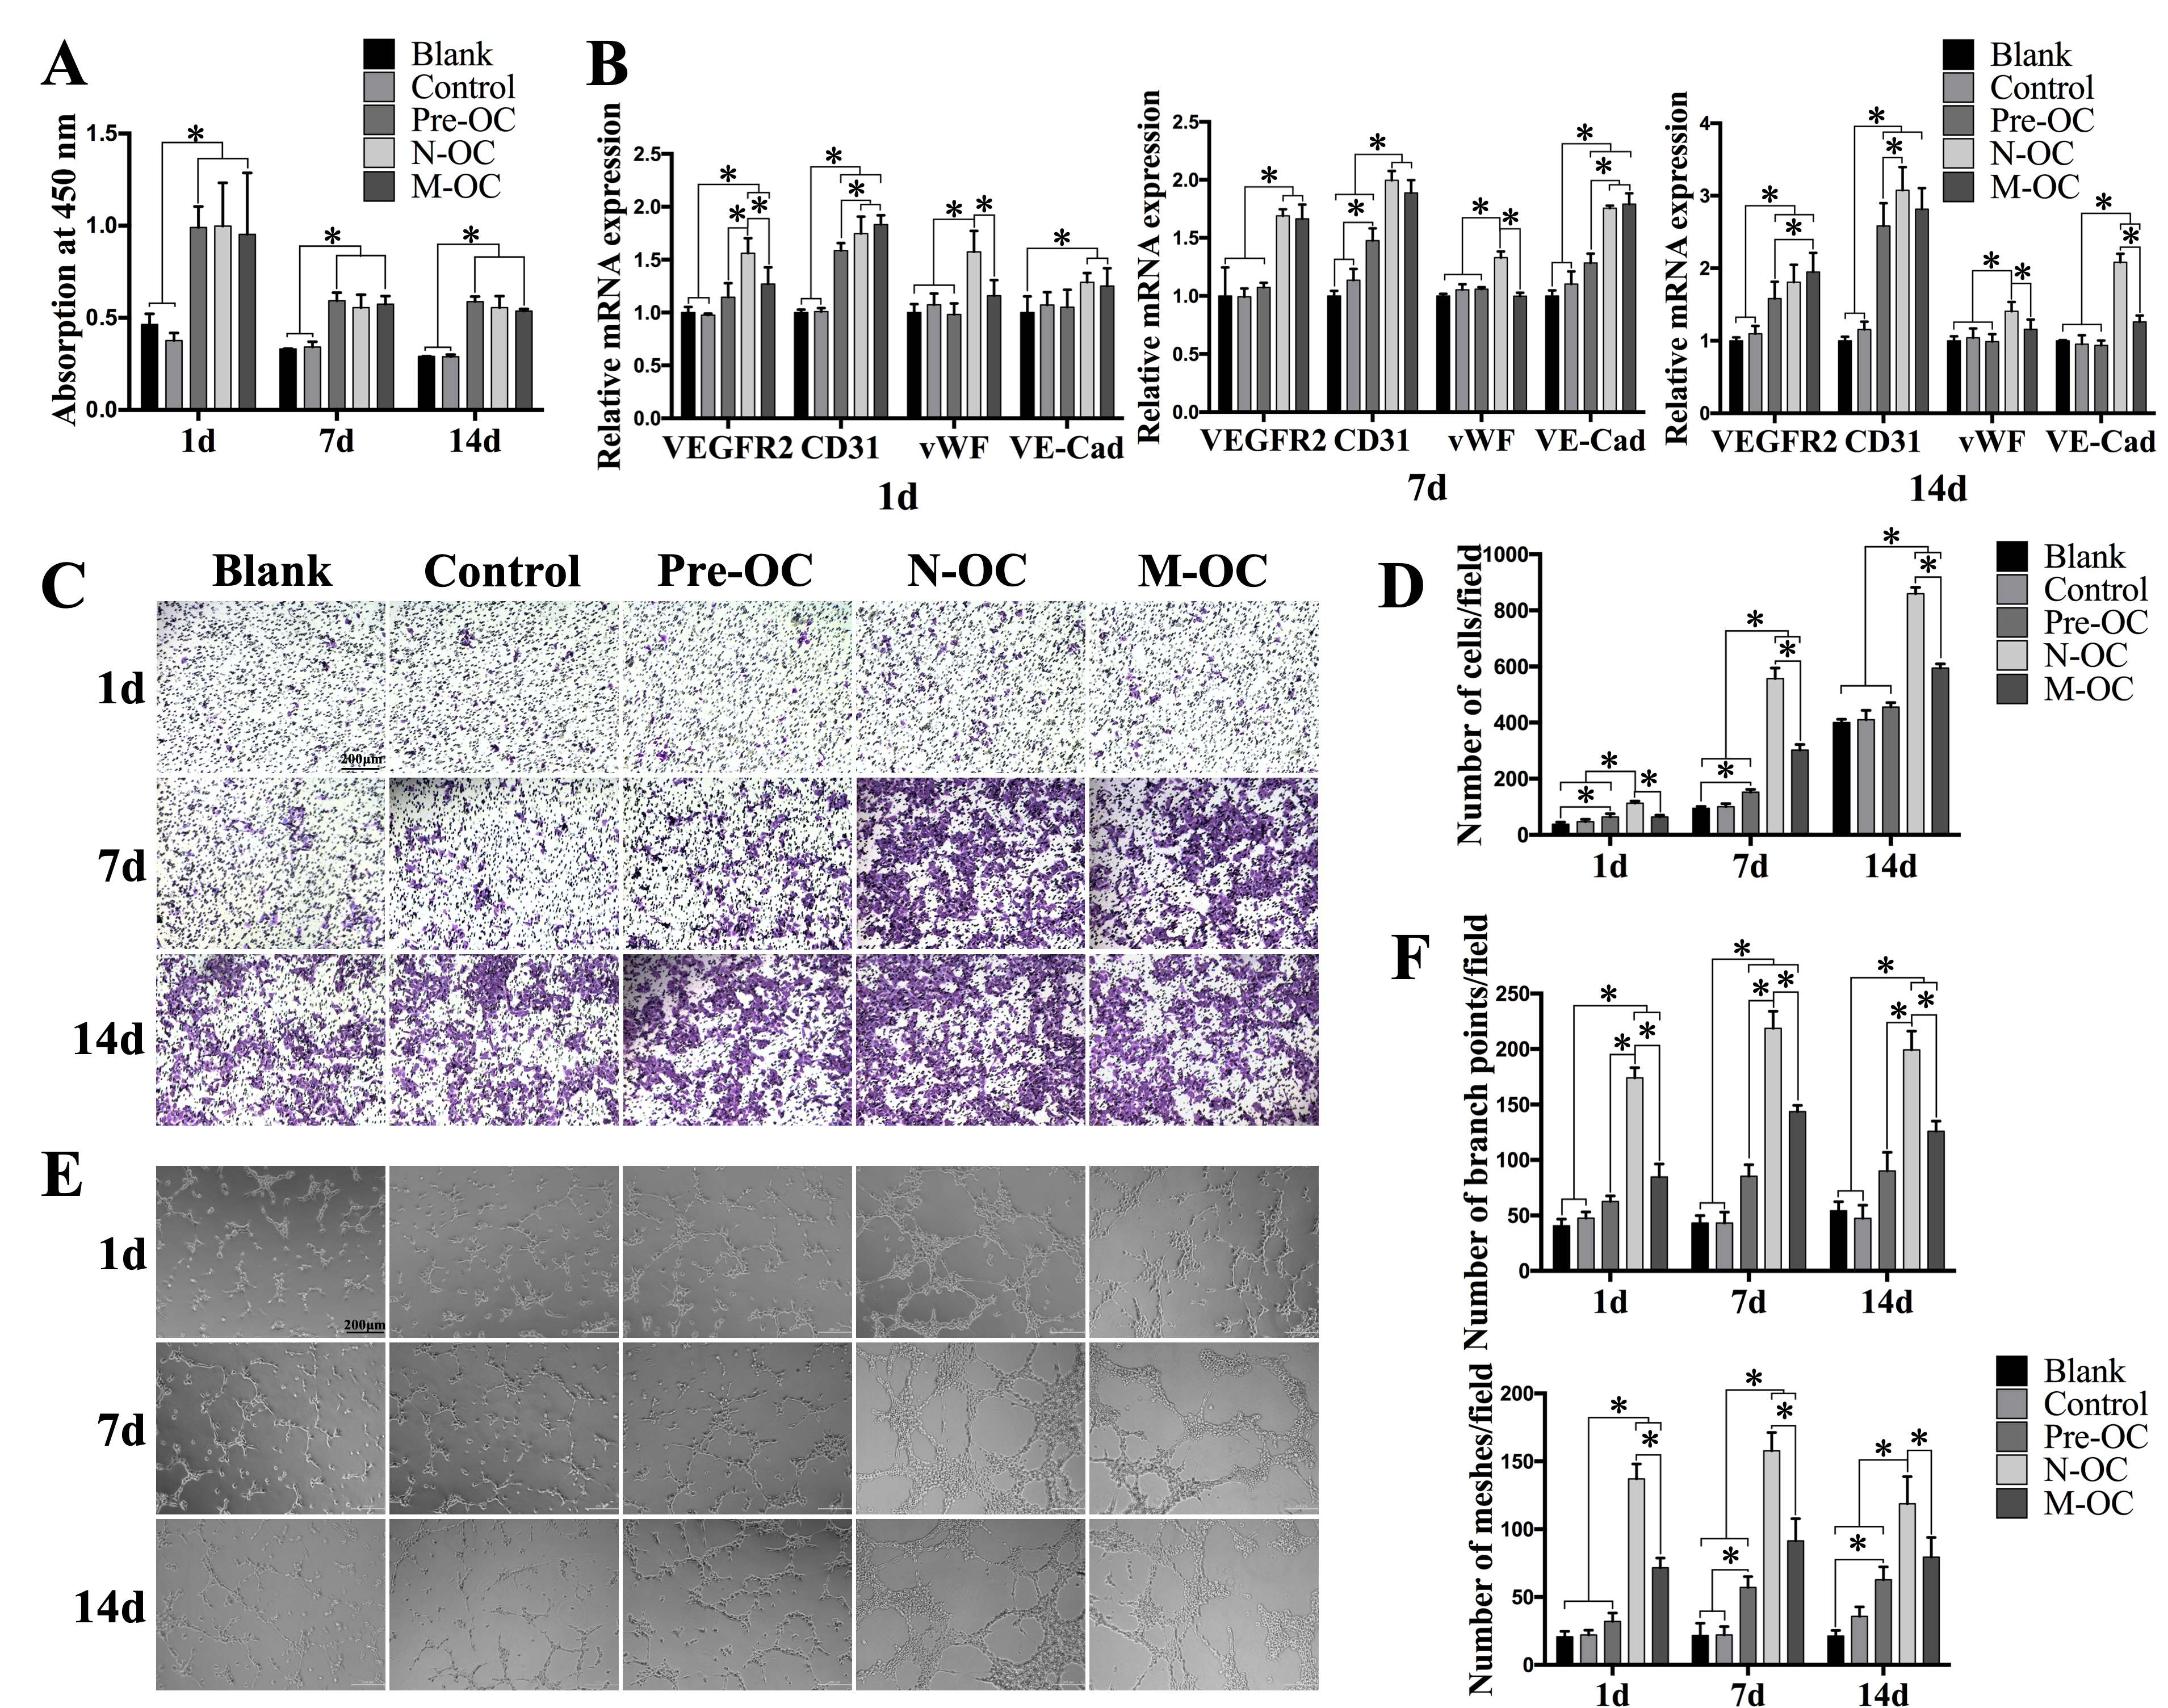
Fig. 2. N-OC and M-OC promotes proliferation, differentiation, migration and tube formation of EPCs. (A) Absorption at 450 nm of EPCs treated with condition medium from Control, Pre-OC, N-OC and M-OC detected by CCK-8 assay at 1 d, 7 d and 14 d. EGM-2MV medium was used as the blank control. (B) mRNA expression levels of VEGFR2, CD31, vWF and VE-Cadherin in EPCs treated with condition medium from Control, Pre-OC, N-OC and M-OC detected by qRT-PCR at 1 d, 7 d and 14 d. EGM-2MV medium was used as the blank control. (C) Light microscopic images of EPCs treated with condition medium from Control, Pre- OC, N-OC and M-OC at 1 d, 7 d and 14 d assessed by migration assay. EGM-2MV medium was used as the blank control. Scale bar, 200 μm. (D) Number of migrated EPCs quantified by ImageJ software. (E) Inverted microscope images of EPCs treated with con¬dition medium from Control, Pre-OC, N-OC and M-OC at 1 d, 7 d and 14 d assessed by tube formation assay. EGM-2MV medium was used as the blank control. Scale bar, 200 μm. (F) Number of branch points and meshes quantified by ImageJ software. Data are shown as means ± SD. *P<0.05.